Cruisin’!
I wrote about cruise lines last December and at the end of May (Cruises are Back!), the gist being that they were beaten down by Covid but might be a good long-term play. Pent up post-Covid demand has resulted in 100% occupancy rates and ships that are crowded and oversold. And most encouraging for the business, their customer base is extending past just retirees and now includes millennials looking for a quick retro vacation.
Since early-May, the market started noticing the vastly improved fundamentals. Last Friday, analysts at Bank of America and JP Morgan issued favorable reports on the industry in general, upgraded Carnival to buy, and raised price targets on Royal Caribbean and Norwegian. The result? A sharp rally in all three. Carnival was the largest beneficiary of the analysts’ largesse, rallying almost 15% last Monday alone and currently standing at up 38% for the month. Royal Caribbean and Norwegian followed suit, and are up almost 18% and 32%, respectively, since the beginning of June. Current 12-month performances are even more impressive: CCL, RCL, and NCLH are up 64%, 142%, and 76%, respectively. Obviously, that beats the S& P considerably, which is currently up about 17.5% over the same period.
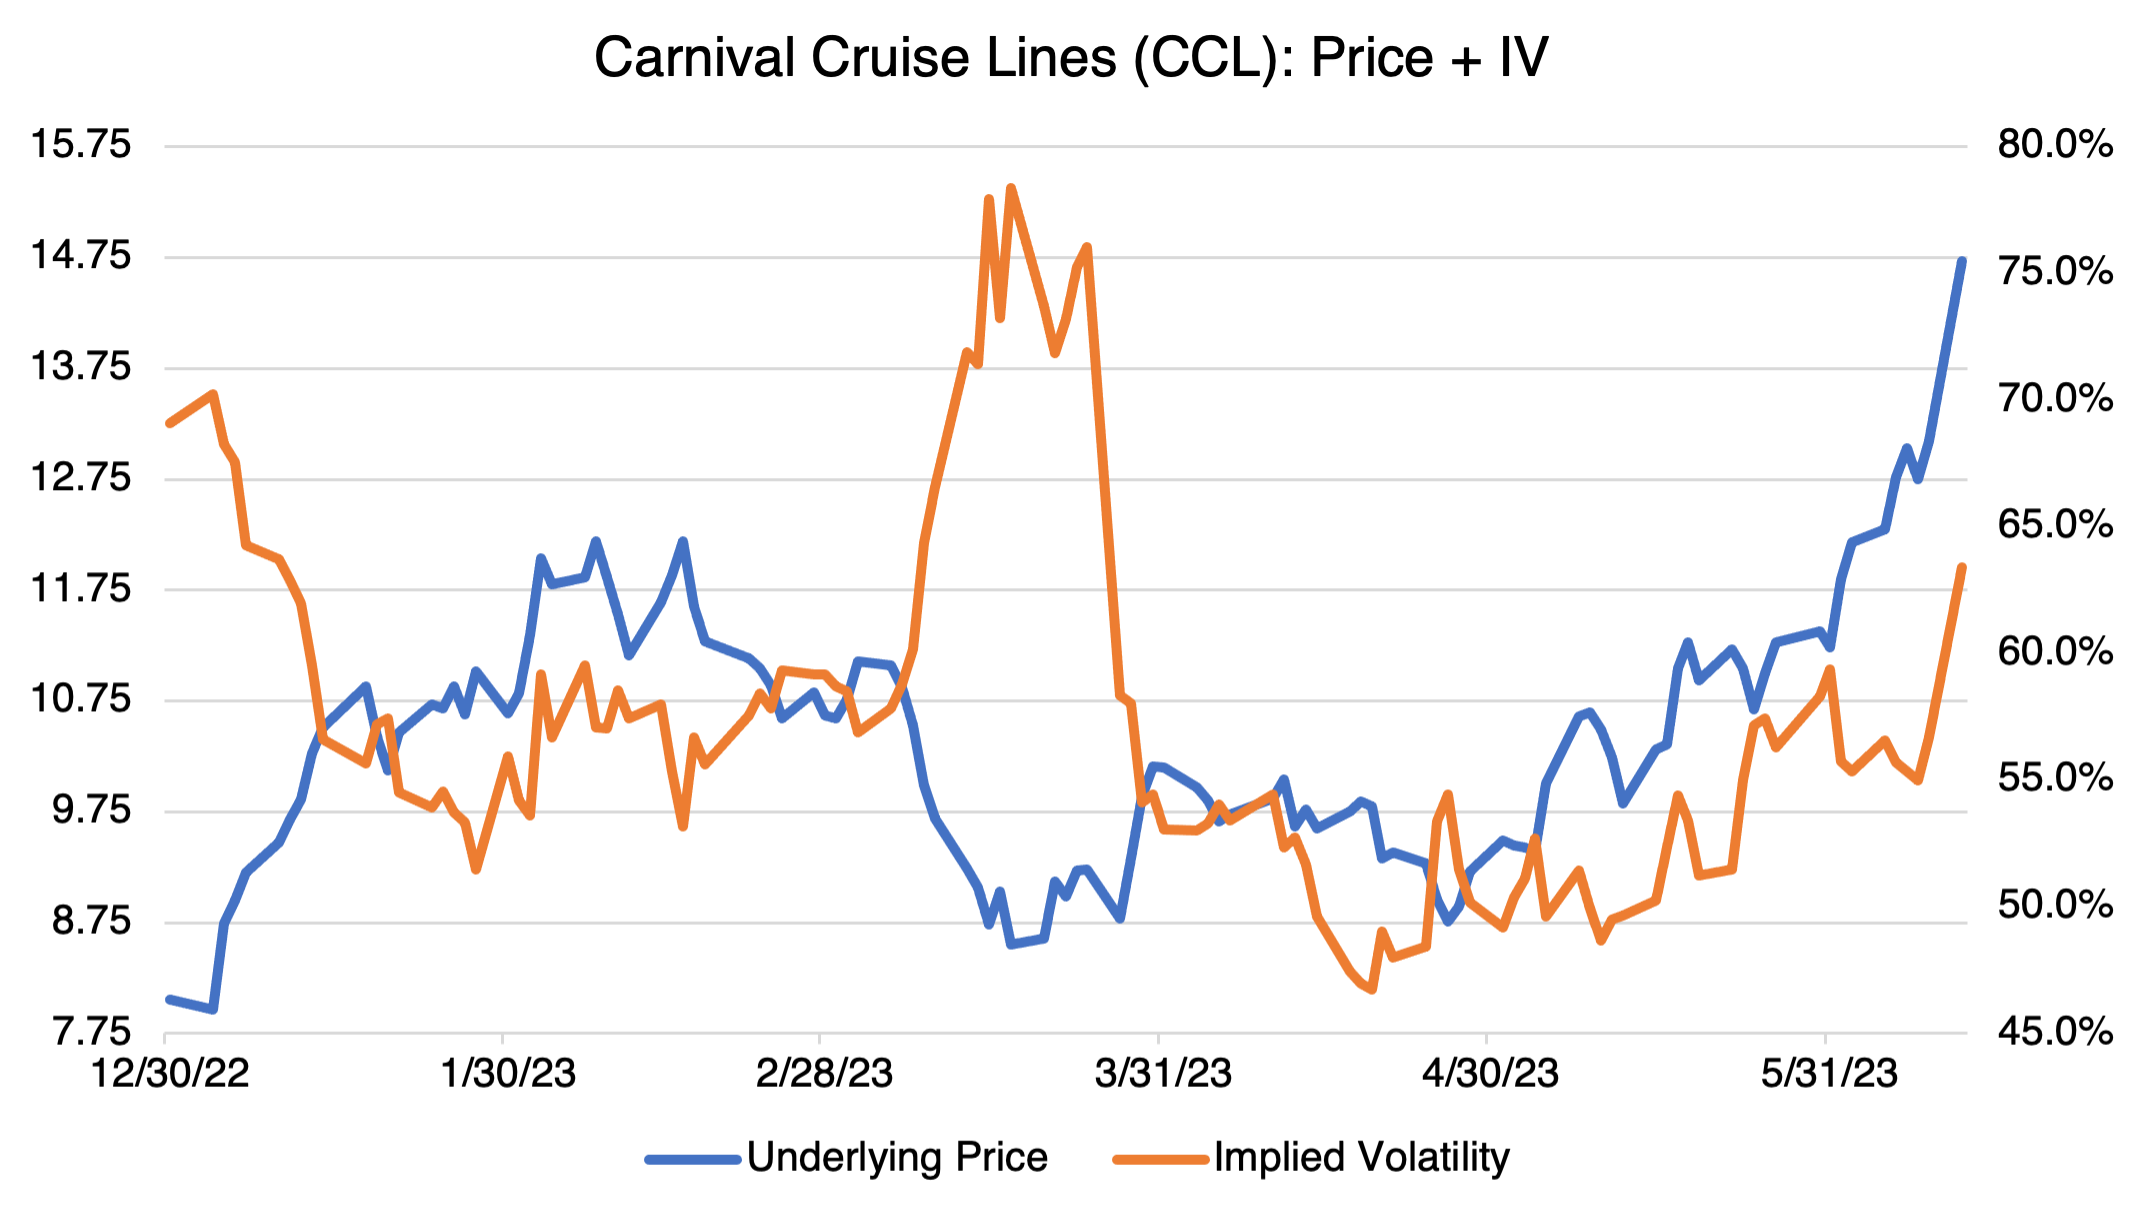
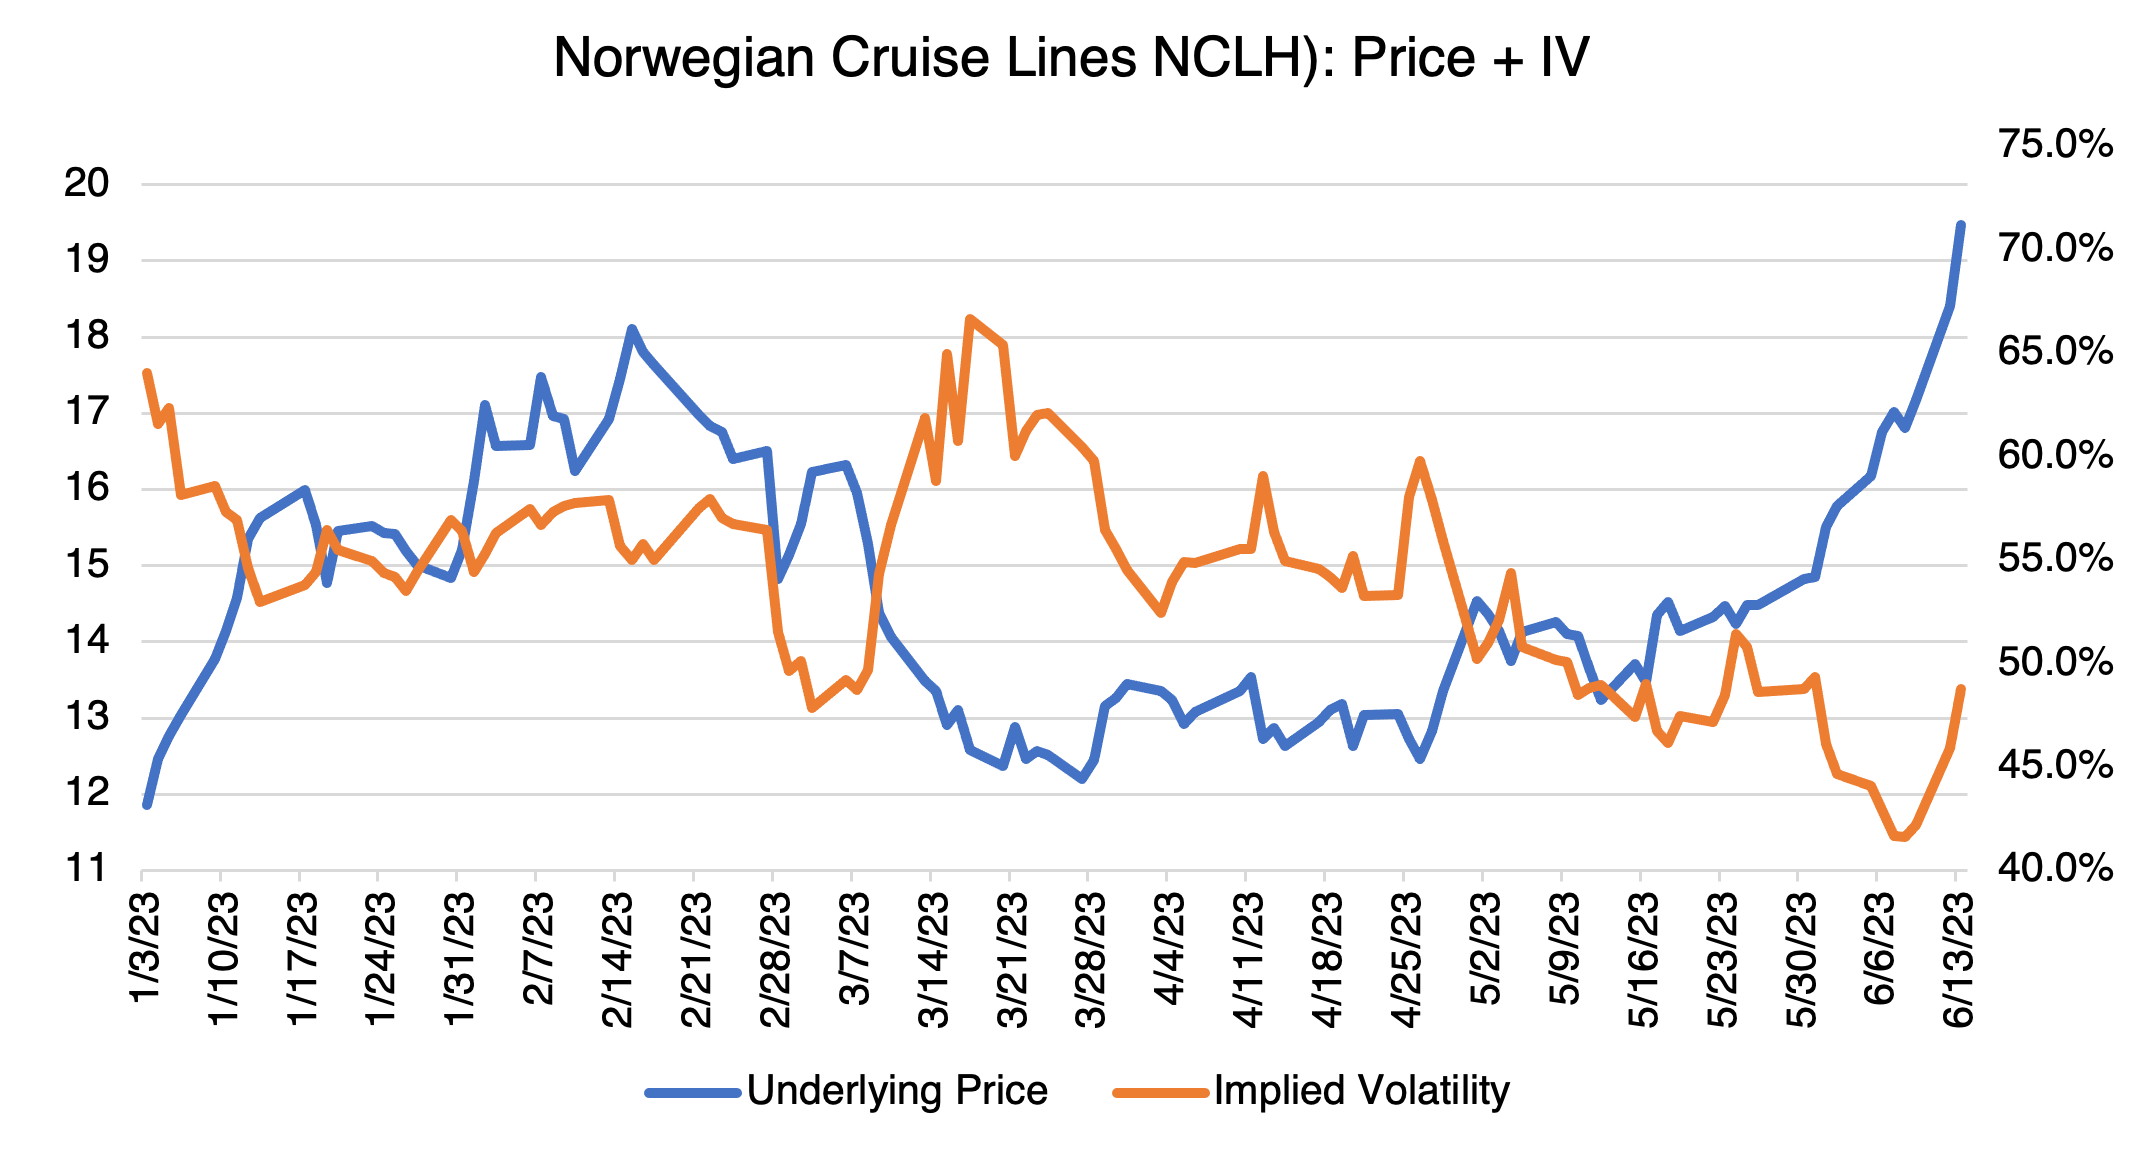
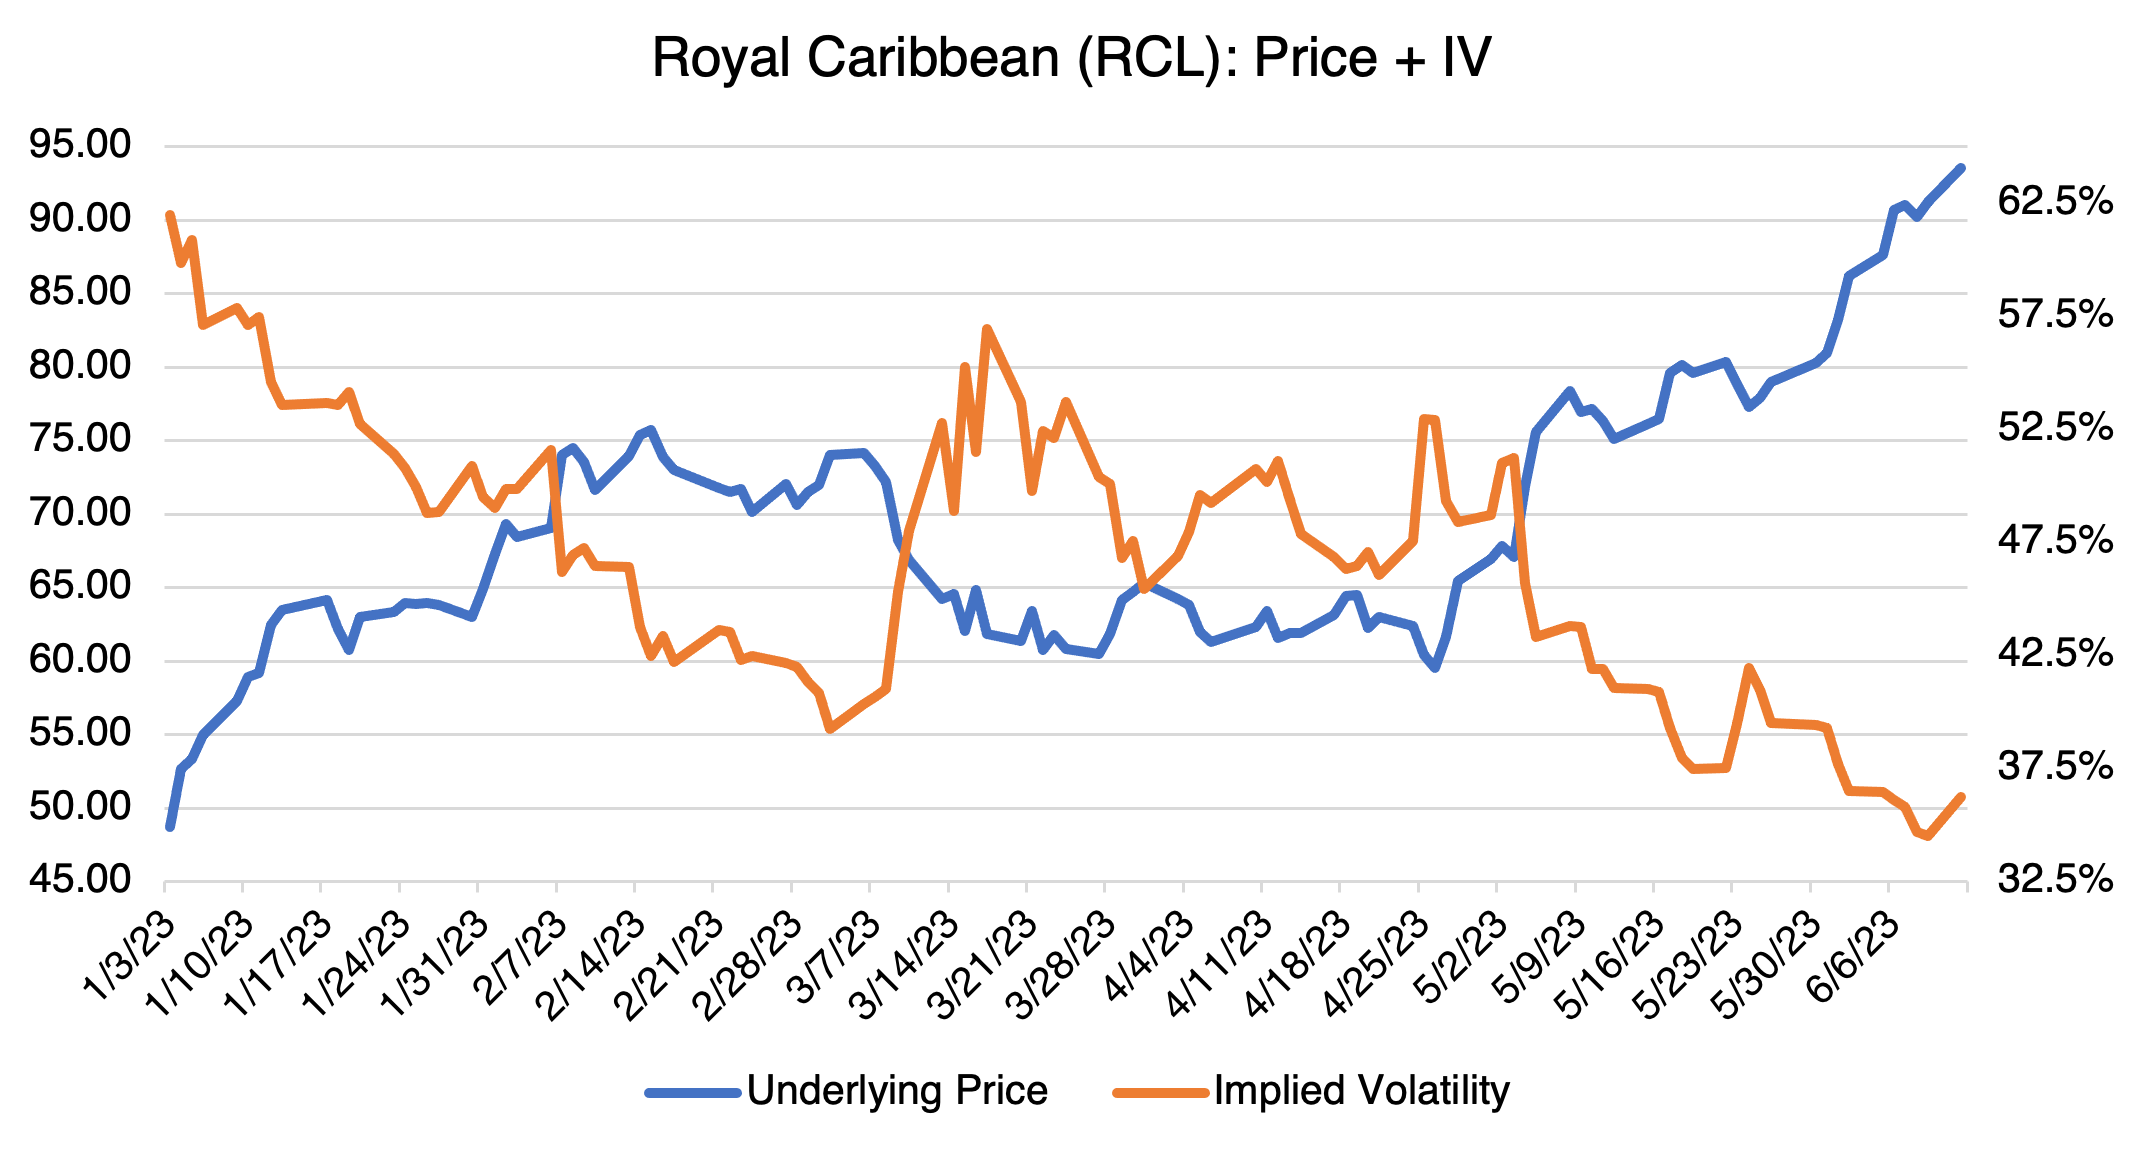
One interesting development for options traders. I previously observed that cruise line stocks exhibit a behavior common to many others, that is that their implied volatility tends to move inversely to their price. Prices up, vol down, and vice versa. Like many things in trading, this is true most of the time, but not always. Implied volatility is a function of historical volatility (the annualized standard deviation of the stock’s daily return, in percentage terms) and future uncertainty. The first element is affected by the stock’s price level since the standard deviation (SD) of daily price returns must increase at high levels in order to keep historical volatility from falling (and vice versa). If the SD of returns moves lower as the stock price increases, then historical volatility, and by extension implied volatility, will tend to decrease, in general. Although the explanation has been simplified (the shape of the historical price distribution is also a factor), this is the usual relationship for many stocks, CCL, RCL, and NCLH included. Although the concept can be confusing, it is crucial to master the dynamics behind implied volatility in order to become a consistently successful options trader.
In the case of the latest action of the stocks in question (see charts below), daily returns and their standard deviation have been increasing to such an extent that historical volatility is increasing as the price level rises. In addition, and in practice, relatively high daily % price changes also increases the uncertainty factor, the second element that goes into implied volatility. Once the daily action calms down, uncertainty and historical volatility will decrease, taking implied volatility down. The normal and inverse relationship between price level and implied volatility will then reassert itself.