LNG Results: A Mixed Bag!
Last blog (2023), I said I would review the short term results of the Cheniere Energy (LNG) options strategies I discussed previously (Visual Greeks and LNG) and (Straddlers Beware).
Summarizing,
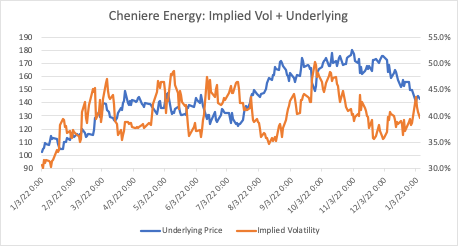
- Cheniere Energy is the world’s second largest producer of liquified natural gas (LNG). Due to the Ukraine war and the disruption of natural gas supply, LNG is now a vital component of Europe’s energy supply. As such, LNG rallied from a low of $122.39 last July, peaking out at $179.86 at the end of October. It’s been in a $148.95 (09/26/22) – $179.86 (11/01/22) range since last summer.
- Three scenarios were possible:
- No new news is forthcoming, and the war remains in stasis; LNG stays within its trading range.
- Extreme cold weather occurs, and Europe moves back into an energy crisis. LNG breaks out of the top of its trading range.
- A mild European winter (so far) and ample reserves propels natural gas lower. LNG breaks out of the bottom of its trading range.
I reviewed three strategies using our options profit calculator to take advantage of these scenarios: an outright put for a downside breakout and a straddle or a strangle to take advantage of an extreme move in either direction. In both instances, LNG was trading $155. The specific strategies are below:
- 12/23/22 review date: Jan ’23 $150 put @ $4.75. Breakeven at expiration: $145.25
- 12/27/22 review date: March ’23 $155 straddle @ $23.55. Breakeven at expiration: $131.45 – $178.55
- 12/27/22 review date: March ’23 $145 put/ $180 call strangle @ $10.60. Breakeven at expiration: $134.40 – $190.60
Since I reviewed these strategies on December 27, Cheniere broke out to the downside on the back of lower natural gas prices, taking out the low of $148.95 from last September 23 and trading down to $139.75 on 01/04. Concurrently, its implied volatility jumped about 5 vol percentage points on the move, up to about 43.5%. Since then, LNG has stabilized somewhat and is trading roughly $144 as of this writing. Below is the latest price and volatility action for 2022 and since last December:
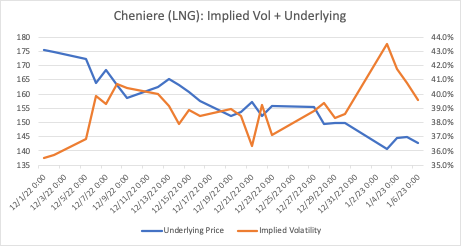
Note that LNG’s implied volatility shot up on the downward move but gave up all its gains as the stock stabilized, retreating back down to the high 30% region. This decreased the value of all three strategies from their peak reached on 01/04, especially for the long strangle and straddle positions.
Since the simple put strategy was the most directional of the three reviewed, it displayed the most profit:
| Strategy | Execution Price, 12/27 | Current Price, 01/9 | Profit/Loss |
|---|---|---|---|
| Long Jan ’23 $150 Put | $4.75 | $7.05 | $2.30 |
| Long March ’23 $155 Straddle | $23.55 | $21.25 | ($0.30) |
| Long March ’23 $145/$180 Strangle | $10.60 | $11.00 | $0.40 |
(You can try these strategies and compare the differences using our options profit calculator tool)
Note the middling short-term performance of the straddle and strangle. These positions were supposed to benefit from a price breakout in either direction, and that did indeed occur, but neither strategy really performed in the short term. Getting the market right but with an underperforming strategy can be extremely frustrating to those new to options trading.
So, what happened? As you can see, straddles and strangles are not good strategies if you’re trying to capture short term, or even long term, moves. Or, more accurately, they will show a profit, but you will have to be extremely nimble to capture it. Remember, the two legs that make up straddles and strangles make them doubly exposed to implied volatility and time decay. If the price move stalls for whatever reason, implied volatility will decrease, along with the value of the trade. And, as you wait for the price move to reestablish itself, time decay will be working against you. As you can see, straddles and strangles are interesting and enticing trades, but they require sustained price and volatility action to make them work — a difficult combination.