SAVE Us!
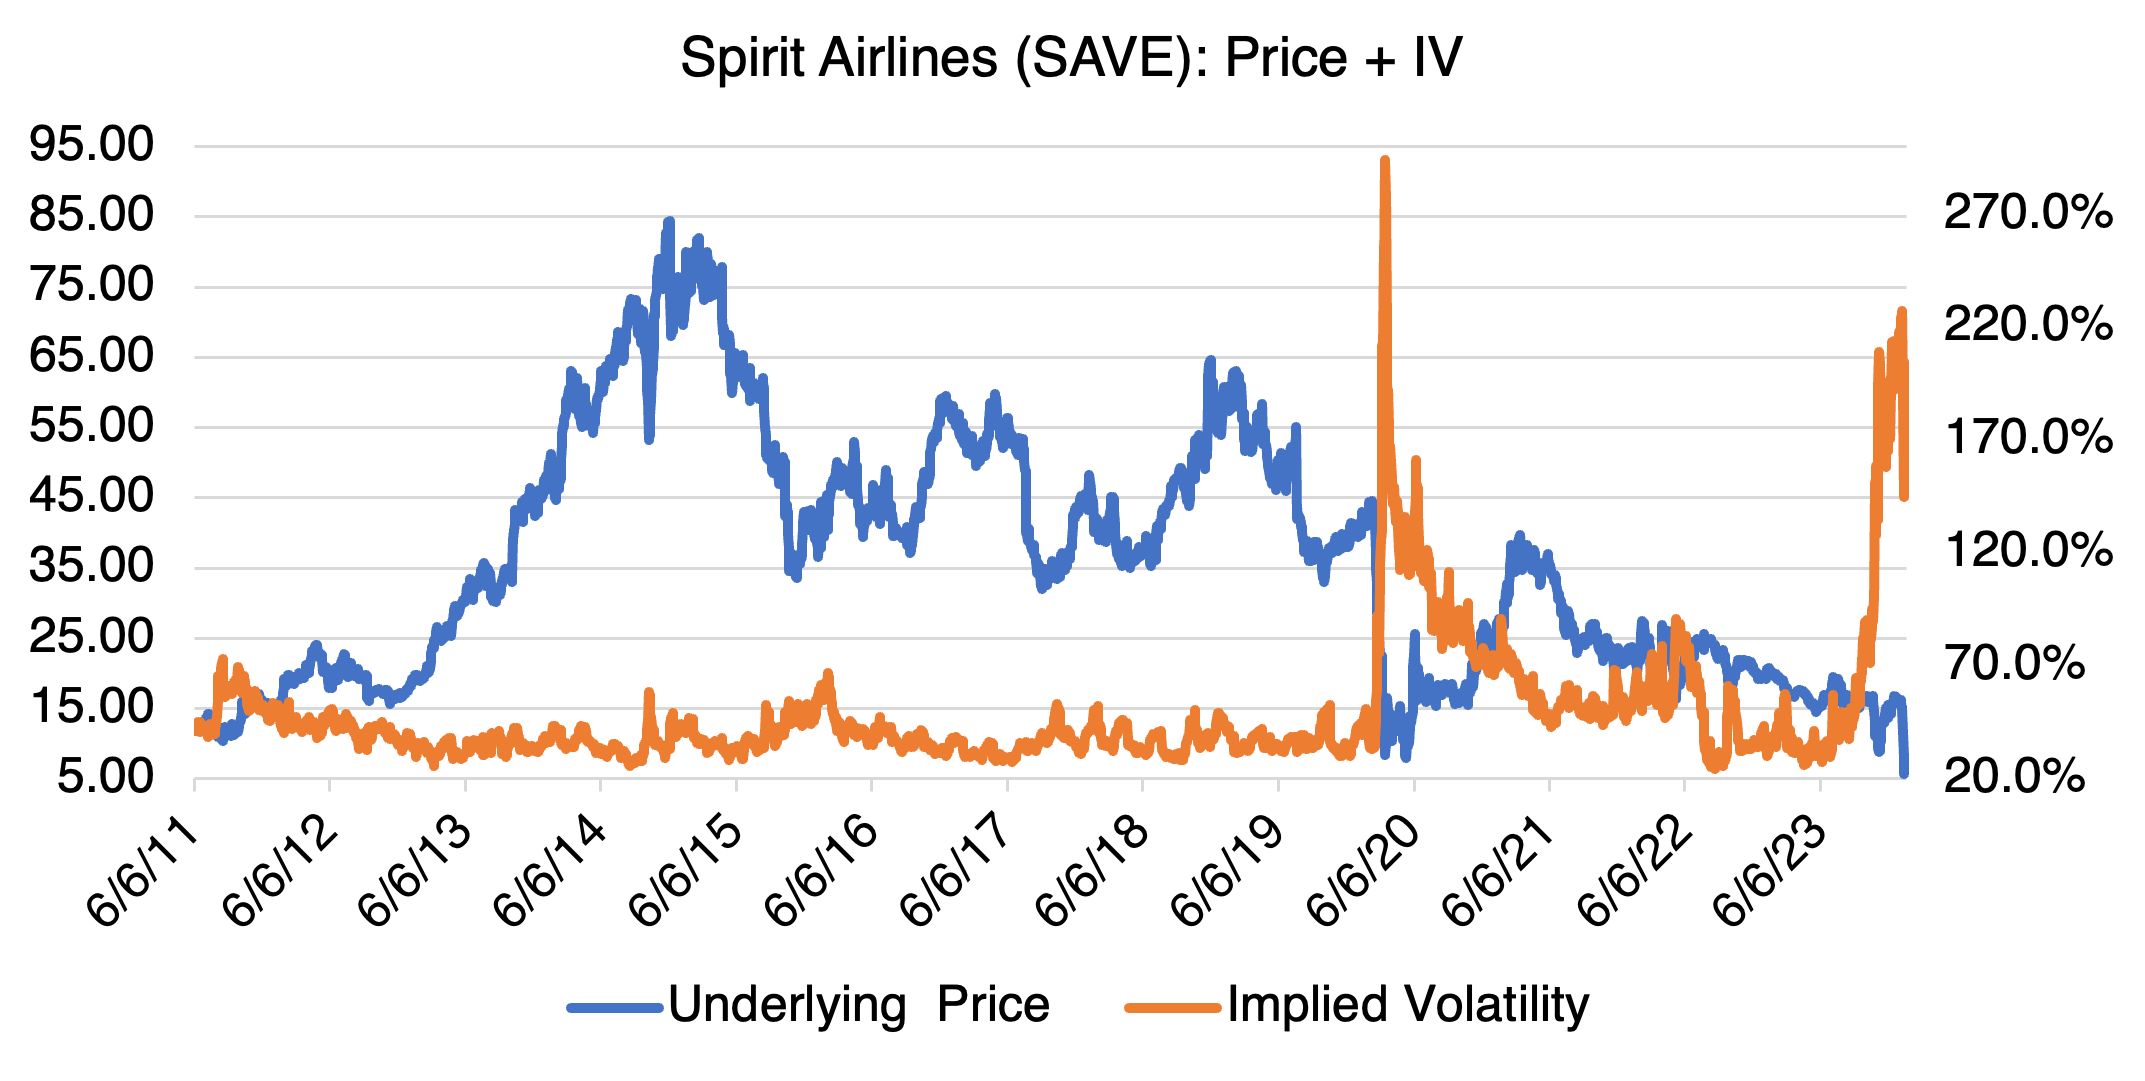
I’m talking about Spirit Airlines (SAVE), and just couldn’t resist the pun. As you probably know if you follow the airline sector, Jet Blue’s proposed $3.8 billion merger with super low cost Spirit was blocked last week by a federal judge on anti-competitive grounds. The stock promptly fell a whopping 47%. Unsurprisingly, Spirit announced soon after that they would appeal the decision and that the deal with Jet Blue was still in effect. After quelling rumors that they were not pursuing “restructuring options,” the airline issued upbeat guidance for Q4 and announced that they were looking to refinance $1.1 billion in debt due in 2025. SAVE rallied 17% on the news; apparently, for the time being, the market is willing to give Spirit the benefit of the doubt.
SAVE bulls believe that if the Jet Blue merger is ultimately rejected by the courts, another low cost airline, such as Frontier (who originally bid for Spirit in 2022 but was outbid by Jet Blue) will step up to the plate. We shall see. Even before the proposed merger, things weren’t exactly great for Spirit, with the stock down almost 59% from its high in 2021. The airline has been plagued by increasing costs, poor on time performance (Frontier and Spirit were both in the bottom three), equipment issues, and operational difficulties. Like all low cost airlines, it has limited ability to raise fares and can be exposed to price wars.
If the merger is ultimately rejected, and another suitor does not emerge, it might mean bankruptcy (i.e., asset sales and debt restructuring) for Spirit. In the meantime, SAVE stock has recovered somewhat, but I suspect it is moving into a “wait and see” phase until the merger and potential buyer situation become clearer.
Unsurprisingly given the uncertainty, SAVE implied volatility (chart below) has been trading in triple digits since last October and is currently running about 185% for the shorter maturities. Since the merger situation will not be resolved in the near term, I suspect that implied volatility will not decline appreciably. Options should therefore remain relatively expensive.
The January Barometer: Does It Work?
The January Barometer, and it’s close cousin, the Santa Claus Rally, attract a lot of attention around the turn of the year. Market indicators that promise untold riches are always popular, and these two fit the bill nicely. Both have a good track record (seemingly) and their underlying logic seems to make sense (kind of). But like most of these almost sure bets, the January Barometer is not as good as it seems.
The Barometer is pretty easy to understand: what happens in January signals what will happen for the rest of year. For example, if January 2024 turns out to be positive, then 2024 should follow suit. There are some variants on which period in January to use (the first day, the first 5 trading days, the whole month), but ultimately they all boil down to the same thing.
The logic behind this is that people with a positive outlook tend to put their money to work at the beginning of the year. If you accept that reasoning, then the Barometer is acting in the same way as a yearly sentiment indicator. Of course, sentiment can and does change during the year, but that’s the idea, such as it is.
Does the January Barometer work? I reviewed the annual returns of the S&P 500 and Dow Jones Industrial Average (DJIA) since 1996 and 1992, respectively, and compared them to the returns for just January and the first few trading days of the year. The results are below:
S&P 500 (1996 – 2023): Percentage of Times Monthly Direction Corresponds to Annual Direction
| Return Direction | Jan | Feb | March | First Day Return, January | First 5 Days Return, January |
|---|---|---|---|---|---|
| Month Predicts Positive or Negative Annual Returns | 64.3% | 64.2% | 67.9% | 60.7% | 57.1% |
| Month Predicts Positive Annual Returns | 46.4% | 42.9% | 53.6% | 46.4% | 42.9% |
| Month Predicts Negative Annual Returns | 17.9% | 21.4% | 14.3% | 14.3% | 14.3% |
Source: OptionMetrics
Evidently, January returns aren’t all that special or predictive. First, February and March yield similar results to that of January, indicating that January is not unique in this regard. Second, part of the Barometer’s accuracy in predicting positive annual returns is just a reflection of the extended bull market in equity. Annual returns of the S&P 500 and DJIA have been positive 75% of the time since 1996 and 1992, respectively. Even the Barometer’s results in predicting negative outcomes (17.9% and 18.8% for the S&P and DJIA) are unimpressive.
The January Barometer isn’t a magic indicator. But, if you still believe in it, and with only a few days to go before the end of January, the SPX is up 2.3% and the DJIA 0.8% as of Monday’s close. Who knows, maybe it will work this year — just don’t bet the farm on it.