Stocks vs. Bonds, Who Wins?
To begin, allow me to wish you and yours a happy, healthy, and prosperous 2024!
In my last blog, last year, I noted that it has become an almost unanimous opinion among many investors that stocks easily outperform bonds. As I wrote, “Measured since 1871, and over a 10-year period, median outperformance was 2.3% per annum; over a 50-year holding period, it increased to 4% per annum.” A new study by Edward McQuarrie, Stocks for the Long Run? Sometimes Yes, Sometimes No (Financial Analysts Journal, Volume 80, Issue 1), comes to a slightly different conclusion. It also highlights the importance of complete and unbiased data and the various biases that may come into play.
It should be noted that all conclusions regarding comparative financial performance and trends are highly dependent on the quality, duration, and scope of the underlying data. Although this seems obvious, many investors often ignore this and jump straight to conclusions that seem correct but should be viewed skeptically. Survivorship bias, or the tendency to concentrate on data that supports a certain conclusion, while ignoring those that did not, often comes into play.
Previous studies comparing bond and equity performance used data stretching back to 1871, although some went all the way back to 1802. Regardless of the time period, the conclusion, first stated in the mid-90s, pointed to persistent equity outperformance and the existence of a puzzling long term equity risk premium. However, new and more extensive data partially contradicts this.
The means by which the new data was collected is interesting, and a testament to the merits of careful (but sometimes tedious) data collection methods. A team led by Dr. Richard Sylla, Professor Emeritus of Economics and the former Henry Kaufman Professor of the History of Financial Institutions and Markets at NYU Stern School of Business, extended the equity and bond return series all the way back to 1793 by reviewing hundreds of newspapers published before 1860. Yes, 1860, before the Civil War, and 1793, only six years after the US Constitution was signed. They also included several securities, such as those attached to the Second Bank of the US, that were not included in previous studies. Similarly, Professor McQuarrie’s contribution was to hand-gather information after 1860 from historical financial publications, thereby producing a more extensive and complete dataset. Most important for both efforts, more failures and defaults were included, reducing the survivorship bias present in previous studies.
After all that hard work (they must have had a lot of research assistants!), what were the results? First, when various defaults and failures are included in the historical dataset, equity outperformance is less consistent than previously realized. Second, the postwar period (1945 – 1975) represents the most sustained period of equity outperformance over bonds since 1792; before then, the record was roughly tied. Apparently, the equity premium is variable and not stationary. Figures 1 and 2 below illustrates these points:
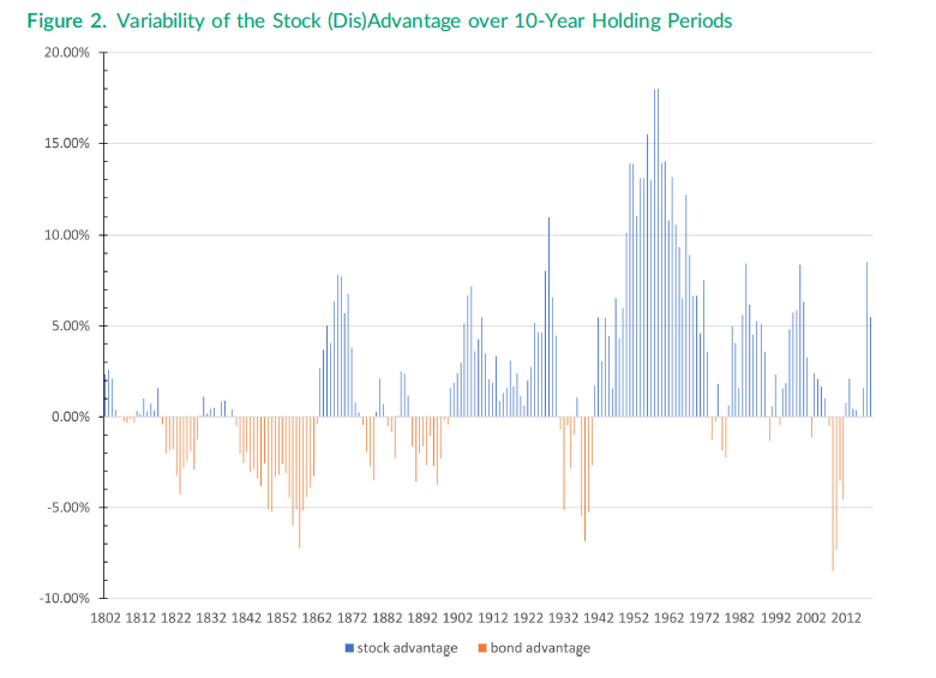
Source: Edward McQuarrie, Stocks for the Long Run? Sometimes Yes, Sometimes No (Financial Analysts Journal, 2023, Volume 80, Issue 1)
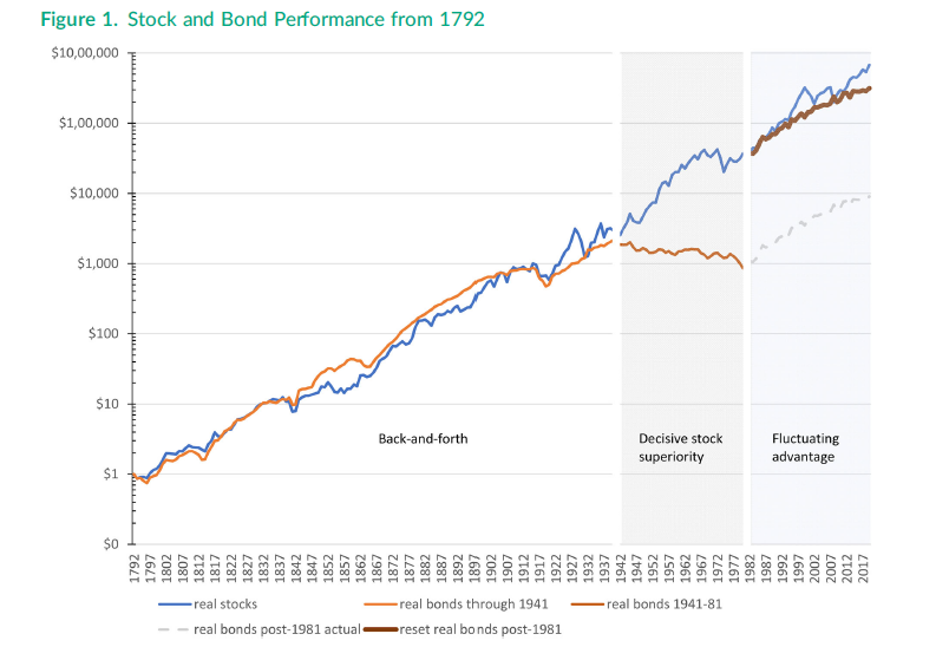
Source: Edward McQuarrie, Stocks for the Long Run? Sometimes Yes, Sometimes No (Financial Analysts Journal, 2023, Volume 80, Issue 1)
It is interesting to note that the results in Professor McQuarrie’s paper are only for US equity and bonds. Worldwide, equity and bond returns for the 50 years ending 2019 were roughly equal at 5.0% and 5.1%, respectively. US exceptionalism, at least in this regard, exists.
One observation. The study uses 10 to 50 year holding period, much longer than most current investors would consider. Investment holding periods have been decreasing since the mid-70s (5 years) and now stand at a mere 10 months.
Of course, the obvious response to any historical study, especially one that goes back almost to the founding of our nation, is to question the relevance of the data to contemporary markets and conditions. After all, what does the Panic of 1837, or stock and bond prices before the founding of the NY Stock Exchange, have to do with markets in the 21st century?
Good question, but you might disagree with my short answer. No period is exactly similar to another, and each has something that is unique to that specific era. Do we eliminate the period including Covid and WW2 because they represented extreme, and some say, unique shocks to the system? Then what about the unlikely combination of inflation and low growth in the 70’s? Or the high GDP/debt levels that we are currently experiencing? Does that lead us to only consider the most current data as the only relevant indicator of the future? Is our current period truly unique in financial history. I don’t think so, and if you were to eliminate all periods that are somehow different, which would be left?