The VIX: Hope Springs Eternal!
If you follow the VIX (which you should if you trade options), you know that it hasn’t been that exciting lately. As I’ve heard many traders and investors say, “it doesn’t seem to move anymore, it’s broken!” That’s a pretty big leap, especially for an extremely popular and high volume 30-year old index and its associated futures. Regardless, a quick scan of the net reveals hundreds of blogs and videos asserting in no uncertain terms that the VIX is finished.
The reasons they give are varied, but usually revolve around the fact that the VIX failed to rally during the two most recent and real crises, the war in Ukraine and the US regional bank meltdown last March. The immense popularity of 0DTE options, and their somehow limiting effect on the VIX, are also mentioned. Of course, there are also the conspiracy theorists, or just those who claim that someone or something is behind every move they failed to call, shouting that the Fed is behind it all. Everyone seems to have an opinion, qualified or not.
Did you know?: OptionStrat is currently the only real-time options profit calculator tool to have indices, including VIX!
In my experience, whenever traders argue that certain products or derivatives are “broken” or “no longer reflecting “reality,” it’s because they are losing money and looking to find something to blame. However, in this case, do the VIX haters have a point?
First, what does the overused term “broken” even mean when applied to the VIX?
- No longer responds to financial or political crises.
- The VIX is responding erratically or is no longer correlated to its historical drivers, such as daily changes in the SPX.
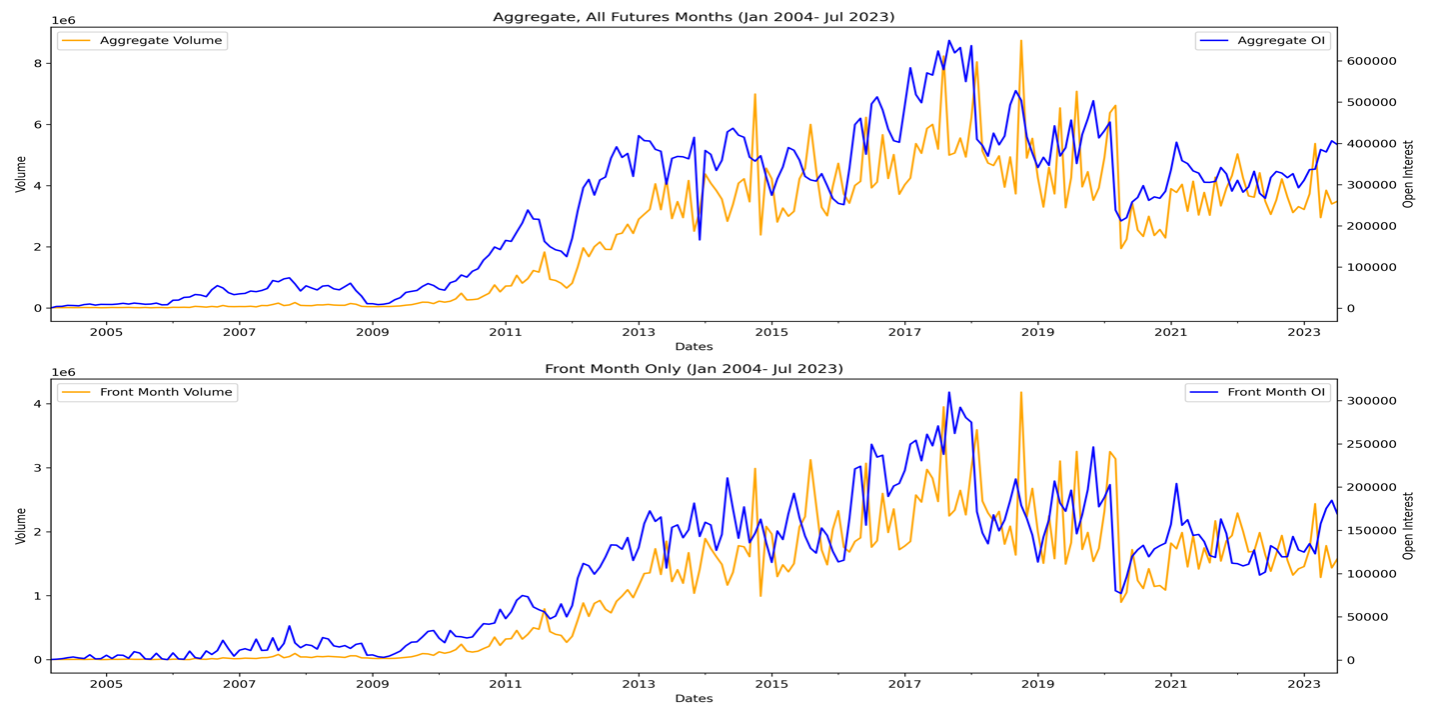
- VIX futures volume and open interest declining, especially in the front month.
Are any of these true? Unfortunately for those leading the charge against the VIX, not really.
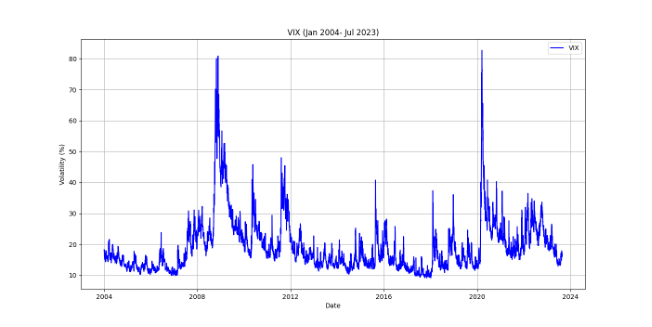
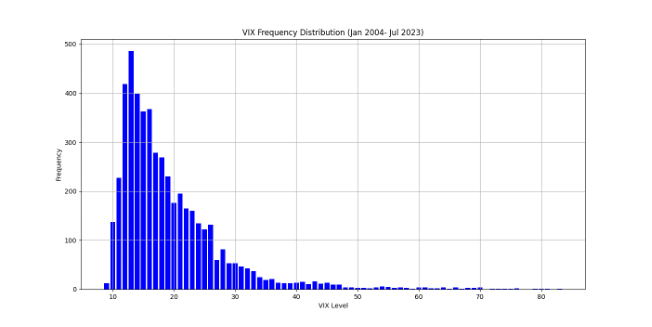
To begin, let’s get realistic about how much, and how often, the VIX really moves, vs. popular perception. In short, it doesn’t move as much or as frequently as most people think. Out of 4926 observations since 2004, only 8.3% were above 30, 3.4%above 40, and 1.5% above 50. See the chart below, as well as the frequency distribution:
Also, recent crises, although seemingly severe, were relatively short-lived and didn’t primarily affect the equity markets, as was the case regarding the regional banking crisis (see chart below).
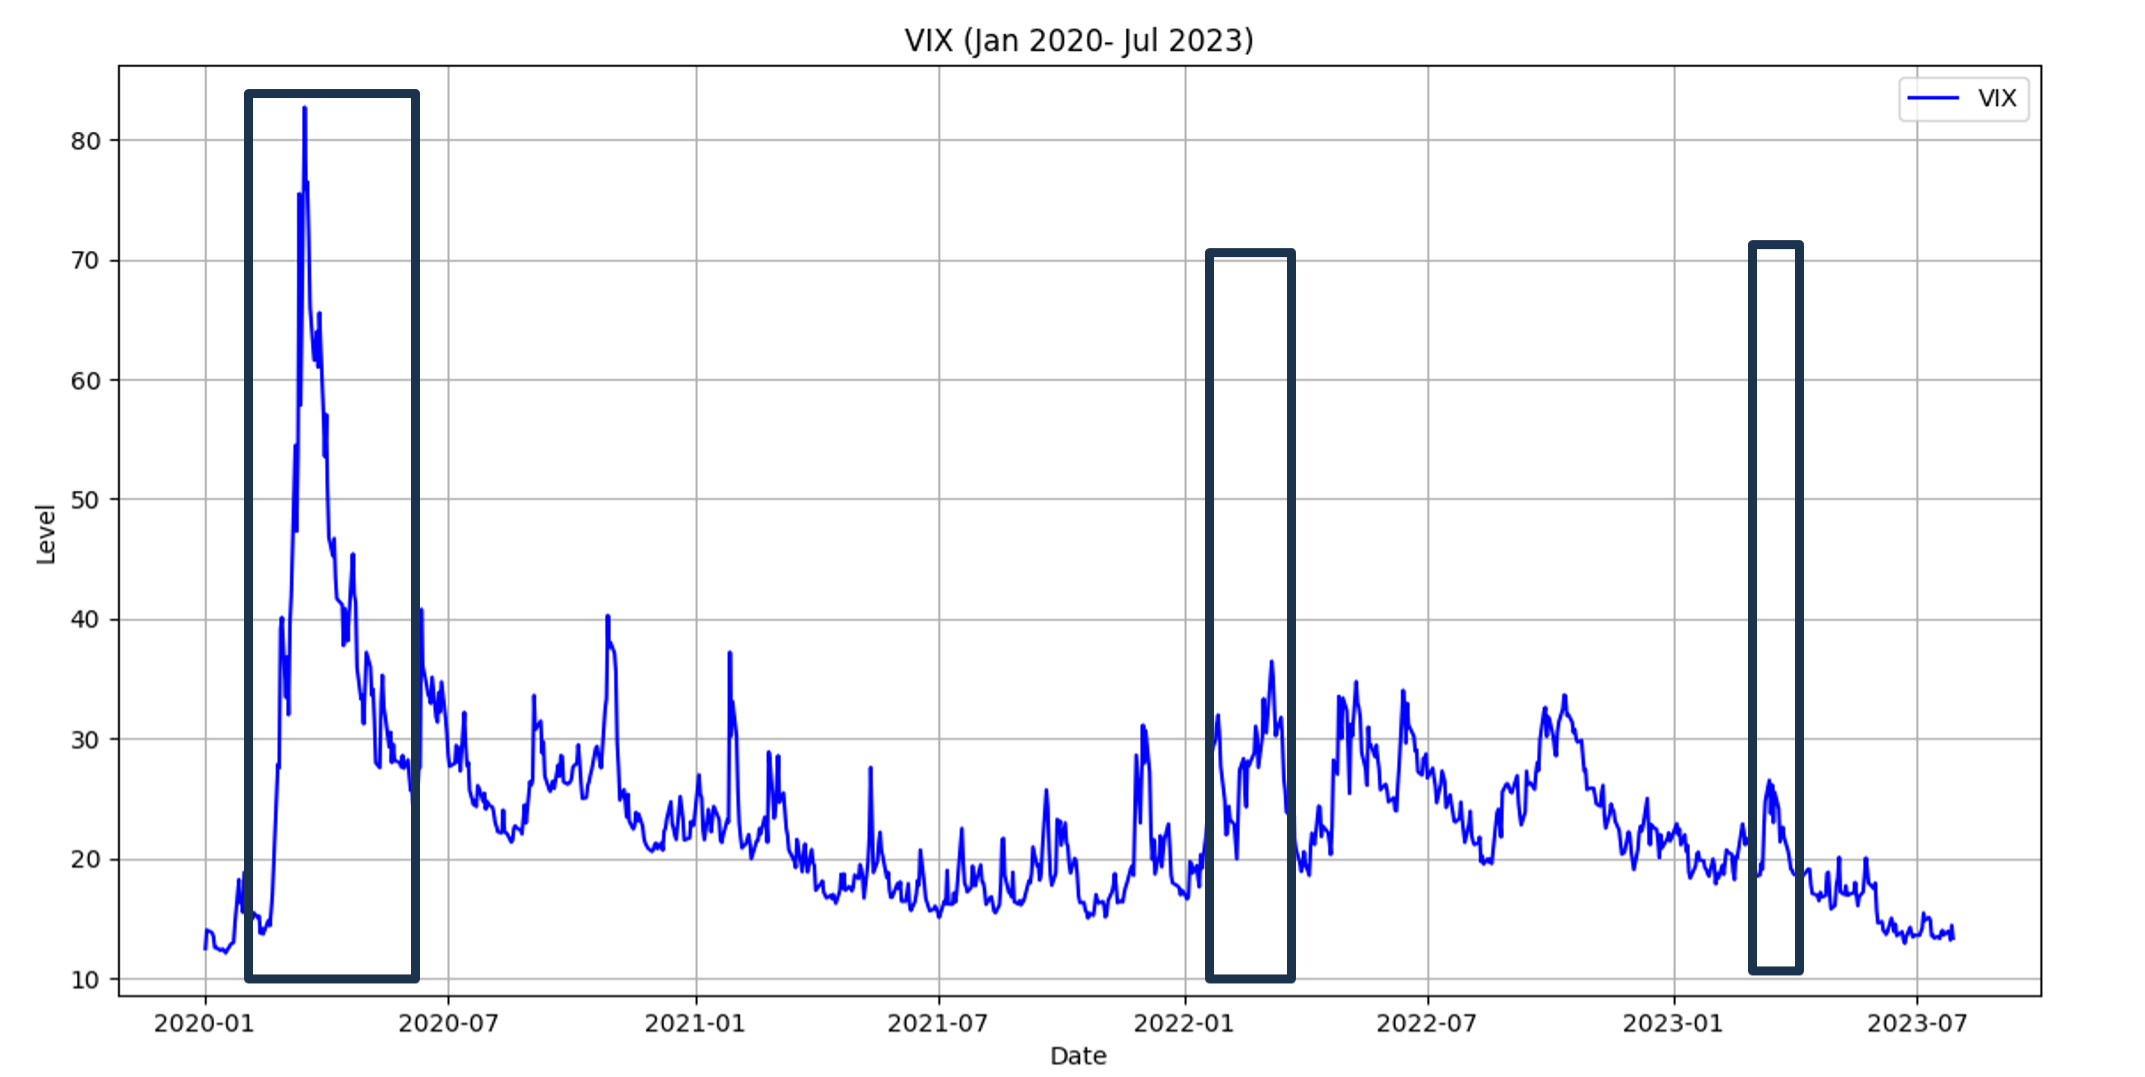
Apparently, sustained and long term upward movements in the VIX are a) rare, and b) tend to require longer duration crises that primarily affect the equity markets.
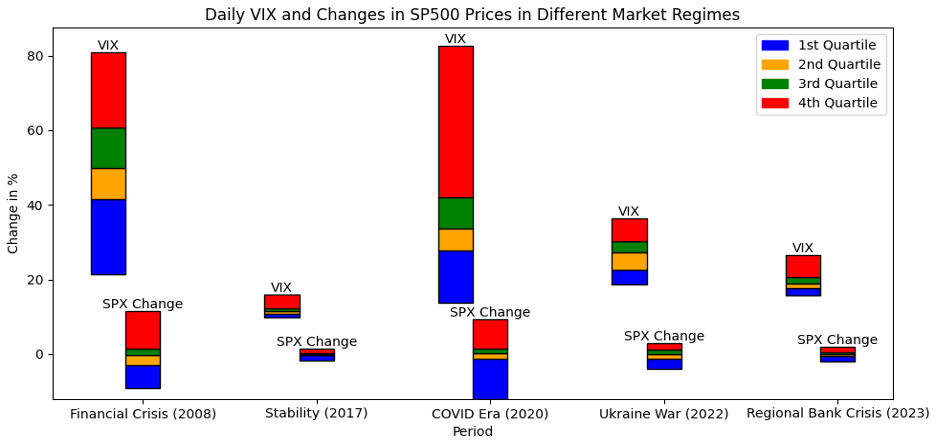
Other, more technical factors indicate that the VIX continues to behave normally. Implied volatility, and hence the VIX, are affected by the magnitude of daily changes. The higher the change from day to day, the higher implied volatility should be. Daily changes vs. the VIX, arranged in quartiles, are displayed below. As you can see, during the two most recent crises, their quartiles did not expand, and in fact remained relatively tight. From that aspect, a VIX spike was not merited, despite the fervent wishes of VIX bulls.
Finally, VIX futures volume and open interest do not indicate a dying contract.
My conclusion: the evidence doesn’t support that the VIX is “broken,” unresponsive, or irrelevant. The VIX has been reflecting conditions that naturally lead to lower implied volatilities. Just because the VIX has not moved as expected by certain traders and observers, does not necessarily mean that the index is suddenly irrelevant or “broken.”
If you’re interested in learning more about this topic, last month I wrote a more detailed and technical blog about the VIX and why it isn’t broken for OptionMetrics(The VIX Isn’t Broken!).
Parting note: 0DTE options and the VIX. An interesting and timely topic and it’s connection to the VIX isn’t completely obvious. More on this next week.