Unusual Options Flow Tutorial
Options flow uncovers large and unusual option trades to monitor what other traders and institutions are doing. OptionStrat scans every trade on the market and filters out the noise to deliver insight into what smart money is up to. Unlike other flow tools, OptionStrat can detect complex strategies such as spreads, condors, and more that span across multiple strikes and expirations.
1. View the daily summary
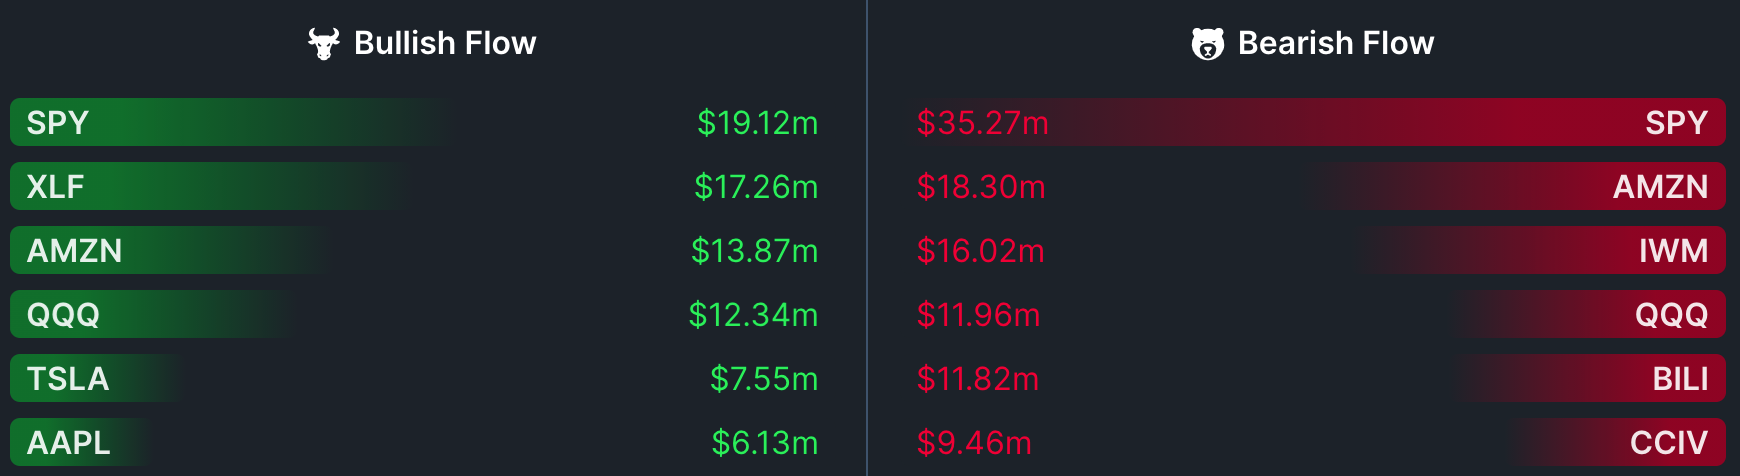
The first options flow screen is the daily summary page, which shows which stocks have the highest amount of bullish or bearish flow. This is a great starting point to find stocks that are leaning heavily bullish or bearish for the day. (bullish flow indicates the trader is betting on the stock going up, while bearish means they are betting on it going down). Clicking any symbol will show the individual trades that have been made for that symbol.
2. View the live flow
The screen you will spend the most time on is the live flow page, which show trades as they are being made.
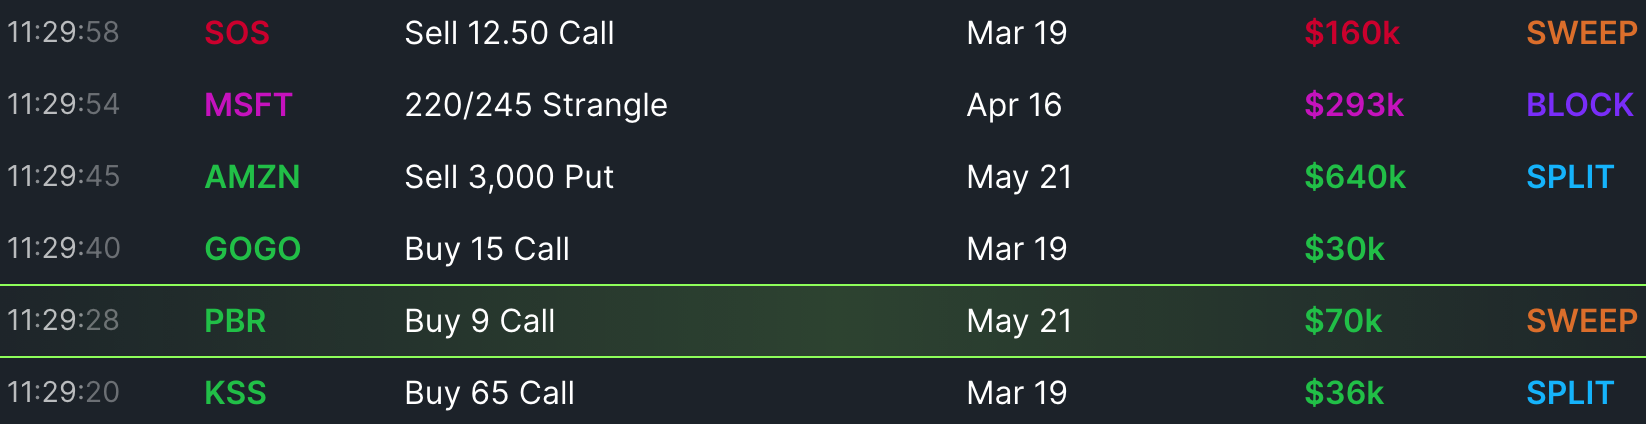
Each line represents a trade or series of trades that were made. The color of stock symbol and premium (which is the total amount spent on or received for the trade) shows the sentiment:
- Bullish: Indicates an upwards move is expected
- Bearish: Indicates a downwards move is expected
- Very Bullish: Indicates a large upwards move (more than the implied move) is expected
- Very Bearish: Indicates a large downwards move is expected
- Neutral: Indicates that the stock is expected to stay around the same price
- Directional: Indicates that the stock is expected to move either up or down, but not stay the same
OptionStrat can identify many different strategies, including complex multi-leg strategies, but most flow will still be simple calls or puts. The meanings behind each type of flow are:
- Single: A normal trade. It may consist of multiple options, but they were each bought or sold in a single trade each.
- Sweep: Orders that execute across multiple trades and exchanges at once. Many individual orders may actually be an urgent larger order that was trying to go unnoticed.
- Split: Similar to a sweep, but only on a single exchange. A large order that was executed as multiple smaller trades.
- Block: Privately negotiated orders that are traded off-exchange. Like splits and sweeps, they are often broken up into smaller orders that can add up once consolidated. Blocks also often span multiple strikes and expirations as a large investor is buying a huge "block" of options.
Note that some flow contains multiple expirations, which are shown as a range. (e.g. Feb 12th - Mar 16th).
3. View details
By clicking any flow item, you can view additional details about it.
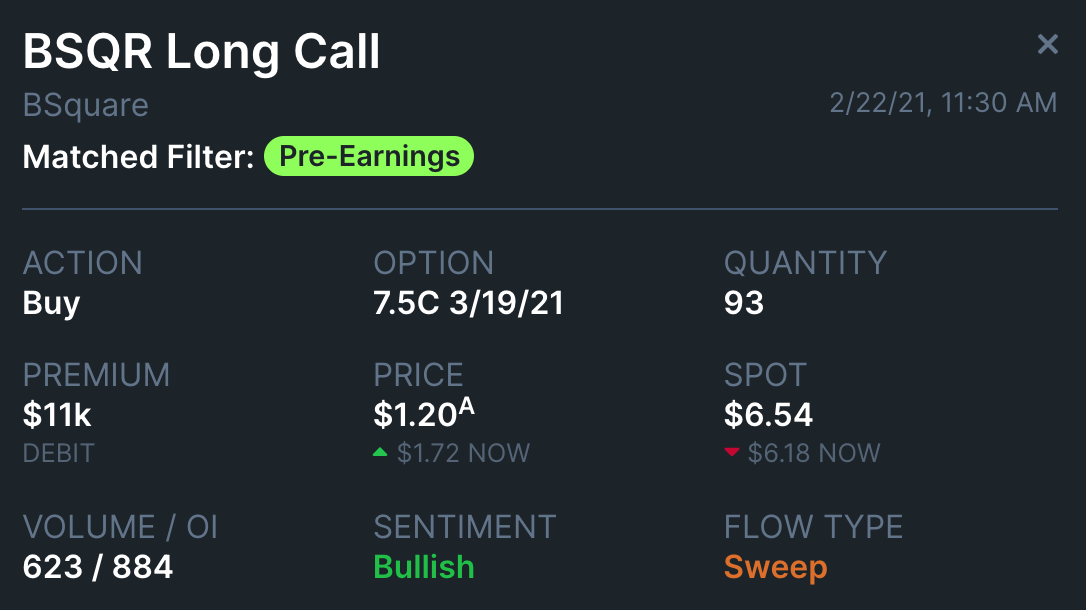
At the top of this screen is the actual order, with each option on a separate line. Most flow will be made up of a single option, but when a more complex trade is made, each leg will be shown.
The premium is the net debit (cost) or credit received for the trade.
The price is the price that the option(s) was purchased (for debit) or sold (for credit) at. If the price was at the ask or bid, "A" or "B" will be shown next to the price. If the price was above the ask or below the bid, "AA" or "BB" will be shown, indicating the order was extra aggressive and the trader was prioritizing speed over price. The current price of the option is also shown below the execution price.
The spot is the price of the stock when the trade was made. The current stock price is also shown below.
The volume / OI shows the volume (number of contracts traded today) and the open interest (number of outstanding contracts, updated daily). When the volume is greater than the open interest, it can indicate than an unusual number of positions were opened today.
The sentiment and type are repeated and were explained above.
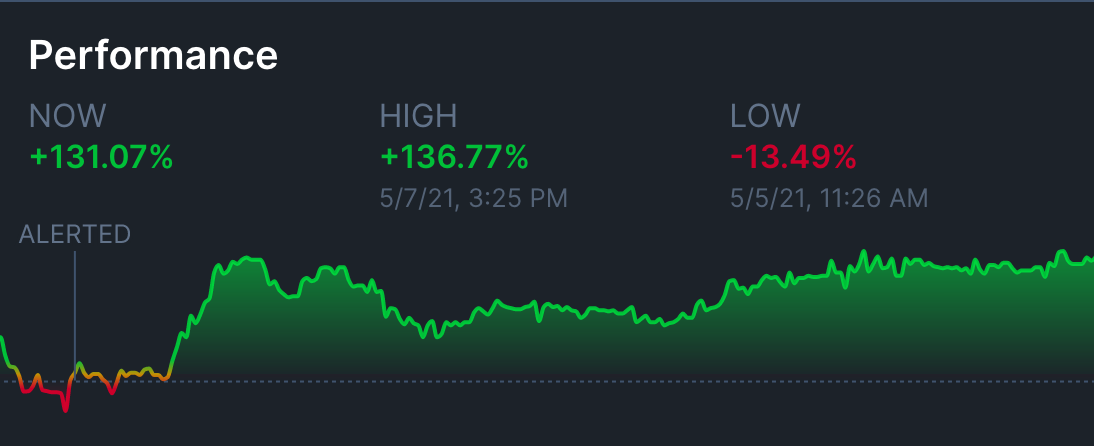
The performance section is only available to paid members, and shows the current profit or loss of the trade, as well as the highest and lowest point that it reached. It also shows a historical chart of the trade performance.
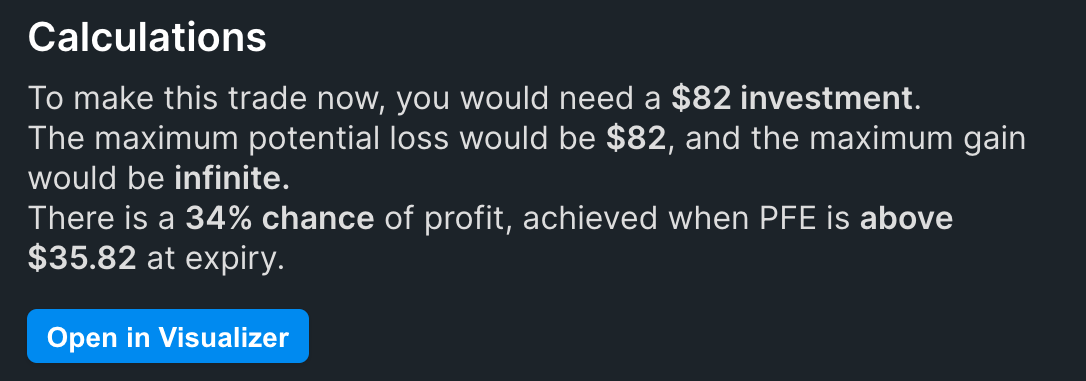
Lastly, the calculations section shows how to make the trade yourself and some basic statistics if you choose to do so. While option flow trades are very large, this section finds the minimum amount you would need to spend (or receive, for credits) to re-create the trade yourself. It also shows the potential gain, loss, chance of profit, and breakeven. Open the trade in the visualizer to see more information.
4. Filtering flow
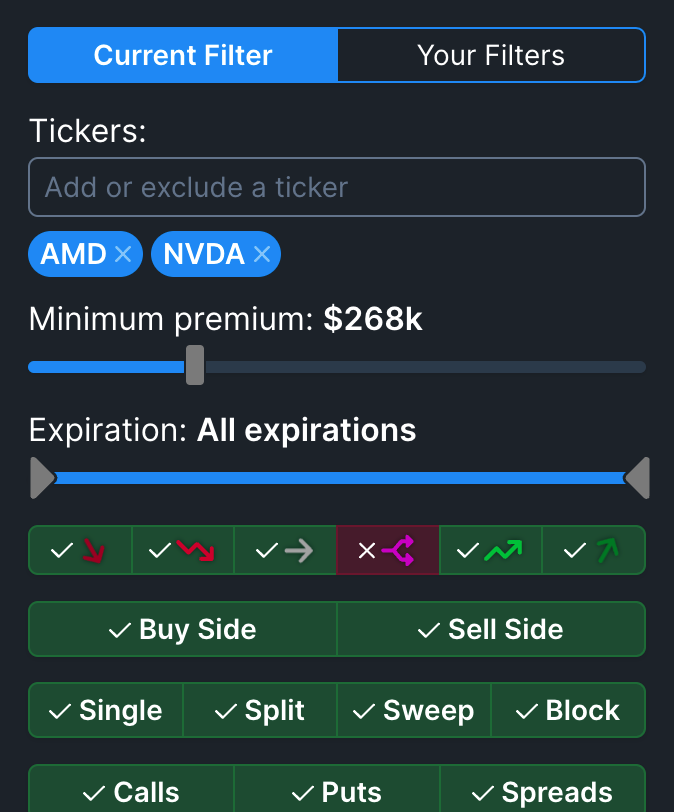
Use the filter menu to search for specific stocks and reduce the amount of trades by applying your own criteria. The first filter with the icons indicates the sentiment for the trade, going from very bearish, bearish, neutral, directional, bullish, to very bullish.
Free members will see a few pre-made filters in the "My Filters" tab. Flow that matches these filters will be highlighted according to the filter color. Paid members can edit these filters, and save custom filters so that they can apply them in the future and add custom color highlighting.
To exclude a stock from the results, use the - symbol before searching it. For example, "-TSLA" will exclude TSLA from the results.
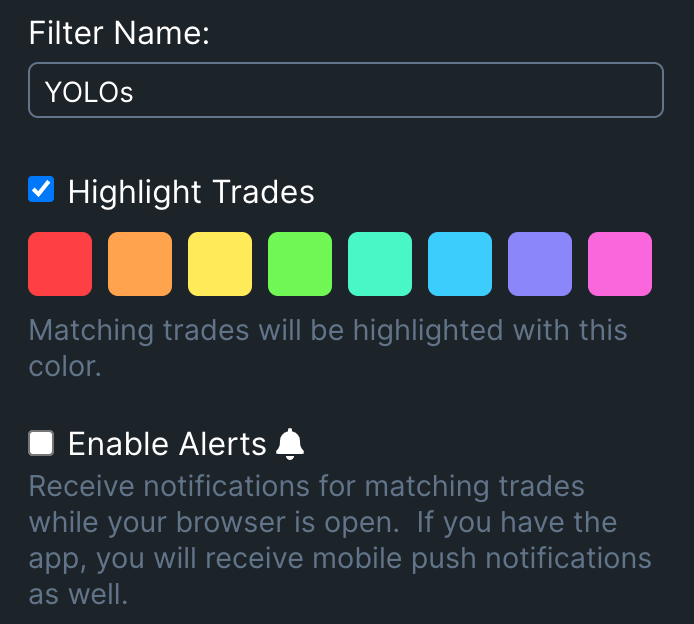
When creating or editing a saved filter, paid members can also enable alerts to receive notifications in the browser while the page is open, or to send push notifications to your phone when flow that matches the criteria is found.
5. Historical flow

Paid members can also use the historical flow page to load flow from previous dates. Since this contains a ton of trades, it's recommended to set strict filters to narrow down the historical data.
Lastly, Remember that options flow is a tool, and blindly copying trades will likely not work out well. Use options flow to find trending stocks, or to confirm your own ideas, but don't rely on it as your sole indicator.
6. News flow
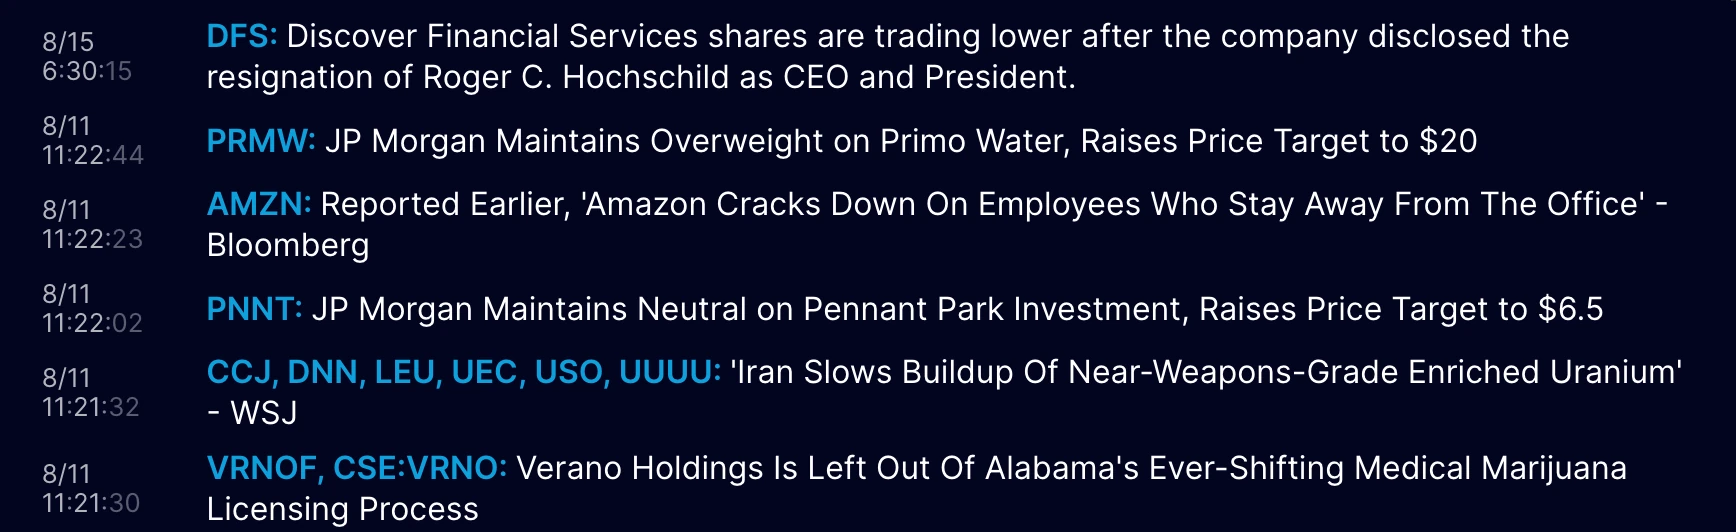
The news flow area shows news headlines in real-time as they are written. These are the same headlines that are shown throughout our website when you are looking at a particular trade. Here you can see them all in one place, and filter them just like options flow. You can also set alerts on these filters to receive a notification anytime news for a particular stock is happening. Like congress flow, these trades are not reported immediately, but they tend to only be delayed by a few days to a week.
7. Congress flow
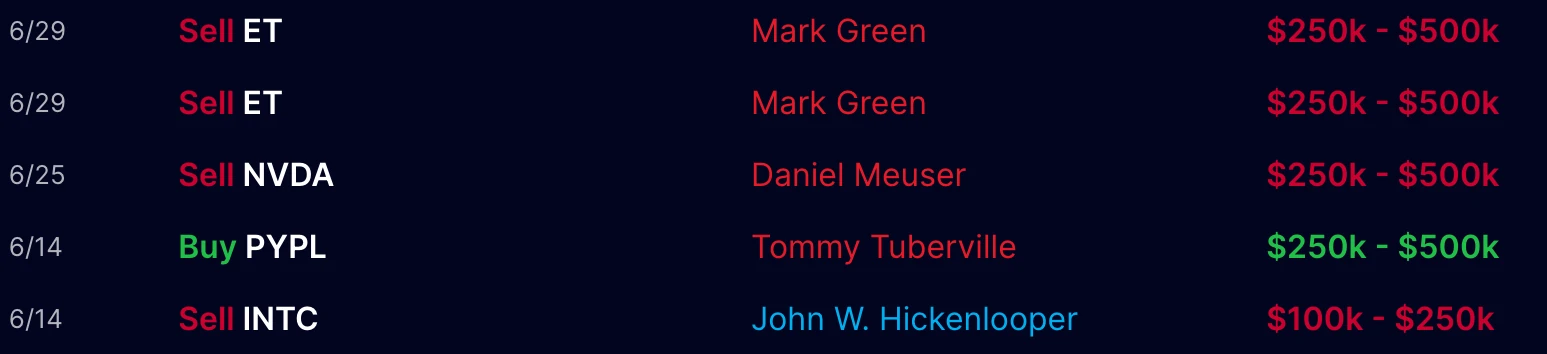
US House and Senate members and their immediate family are required to report stock trades within 45 days of making them, in an effort to reduce conflicts of interest. Many of these members beat the market, potentially due to the insider information that they know. The congress flow area lets you see and search these trades as soon as they are made available to the public.
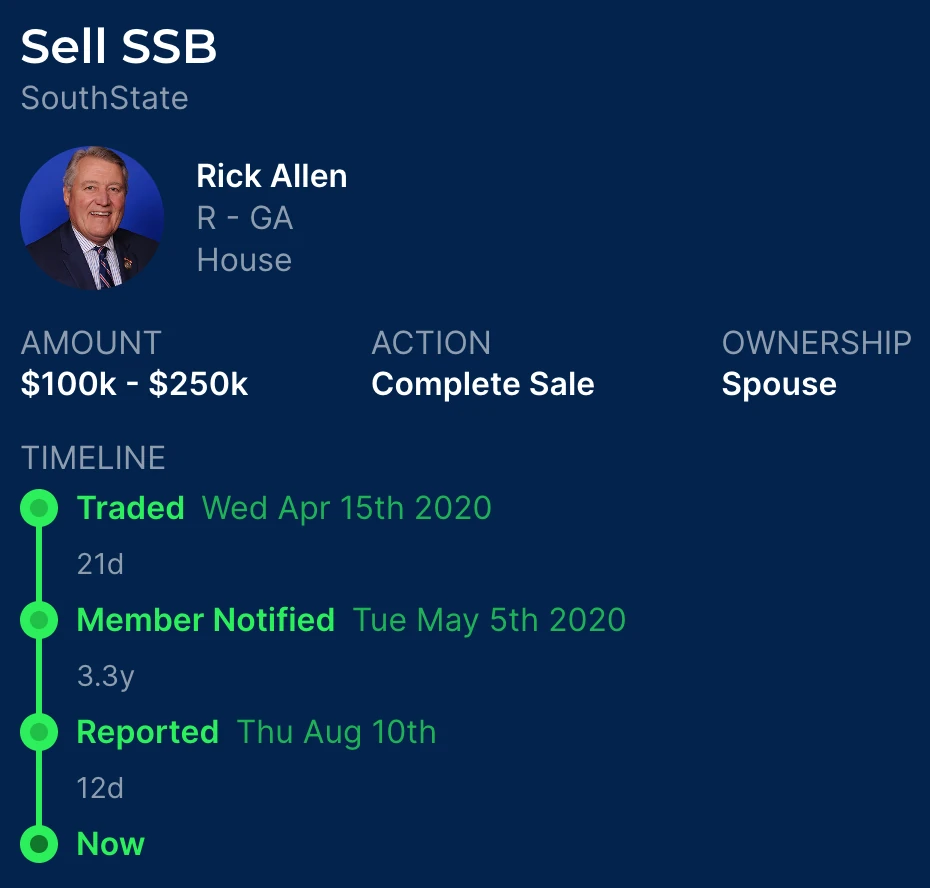
Clicking any congress trade will show some additional details, including a timeline of events. Only house trades will show when the member was notified (for example, if their spouse made the transaction).
8. Insider flow
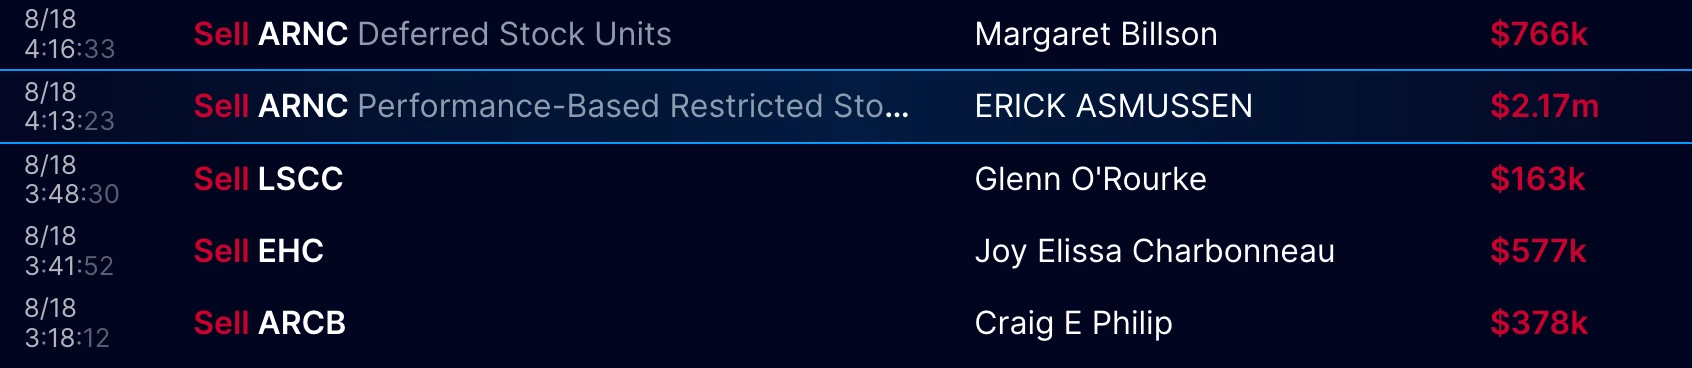
Company insiders such as CEOs and other executives are required to report trades they make on their company stock to the SEC. The insider flow compiles all of these public disclosures in one place, so you can see when company insiders are buying or selling. They are usually simply buying or selling the company's stock, but you will occasionally see option trades as well as other securities like RSUs (restricted stock units). Sometimes they will receive the stock as an award or grant, which will be noted on the details screen when any item is clicked.